Leveraging An Inventory App For Easy And Reliable Inventory Reporting
April 19, 2021
Inventory reports can benefit businesses of all sizes and sectors. They hold a wealth of information that can be used to drive revenue, save costs, and broaden market share. However, studies show that nearly half of all small and medium-sized enterprises either do not track inventory or use manual tracking methods. As a result, these retailers are often susceptible to inaccurate reporting.
Inaccuracies in inventory reports can be detrimental to a business. Many of the decisions you make are informed by inventory data, and the quality of your reports could be the difference between success and failure.
Fortunately, gone are the days when getting inventory reports was an uphill task involving countless hours and mountains of paperwork. Today, an inventory tracking app can deliver all the essential reports to your palm without breaking anyone’s sweat. With the right app, you can divert most of your time from collecting and analyzing data to optimizing your inventory.
Let’s take a look at the ins and outs of inventory reports and how an inventory app can help you generate them quickly and effortlessly.
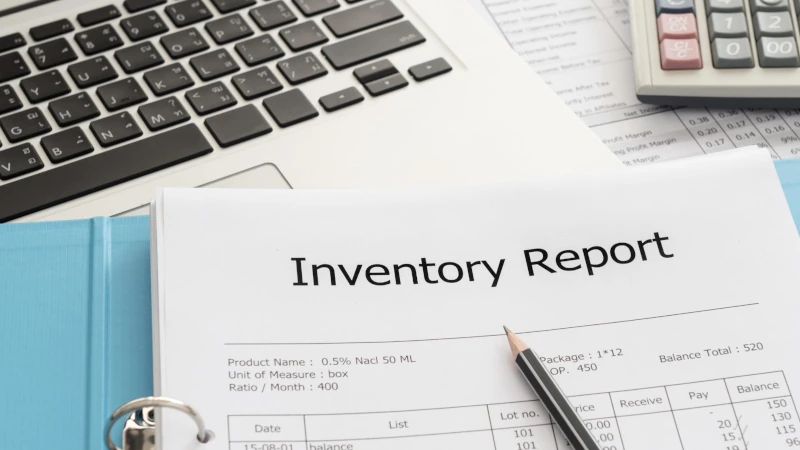
The importance of inventory reports
Inventory reports give information about your stock. They tell you how much inventory you have, which items are selling the fastest, which categories are best-performers, and any other relevant information about your stock’s status and movement. These reports are crucial because they give you a comprehensive view of the assets that matter most to your business. Your inventory is the source of all revenue and profits. Without it, you would not have anything to sell.
The value of an inventory report depends entirely on the insights it can provide. The top companies in the world are profoundly data-driven. They heavily rely on inventory reporting metrics to get both big-picture and focused insights and use them to generate actions across multiple departments, from production and supply chain to sales and marketing.
Types of inventory reports
Inventory reports come in different types, depending on their purpose, audience, and insights. Below are some must-have reports that an inventory app can help you generate and analyze for actionable insights.
1. Available inventory report
The available inventory report tells you how many items you have in your store, their storage locations, and their value. This information is essential because it helps you measure inventory capital, know when to reorder, forecast movements, and budget. Available inventory reports are available for real-time viewing and downloading in most inventory apps.
2. Low-stock report
Stockouts are a no-no in business. Not only do they cost you sales, but they also compromise customer satisfaction and weaken your stand against the competition. Studies indicate that companies lose a whopping $1.75 trillion every year because of stockouts, overstocks, and returns.
The low-stock inventory report informs you which items are running low, based on predetermined minimum stock levels or re-order points. An inventory app can deliver real-time notifications when a stock item goes below the reorder point. That way, you can replenish before the shortage impacts your business.
Considering the cost of stockouts, low-stock inventory reports are critical. Running them frequently enables you to uncover the products constantly going below the allowable stock level and implement measures to optimize availability.
3. Product performance report
The product performance report answers questions like how fast your items are selling and which products give you the most return. It outlines how much merchandise has moved from your warehouse to your customers over a given period. With this information, you can determine which products are worth pushing and refocus your resources for maximum ROI.
The right inventory app can give you comprehensive product performance reports at the touch of a button. You can see sales within a period, as well as the last time a product moved from your store.
4. Shrinkage report
Shrinkage is inventory loss attributed to factors like theft, fraud, administrative error, and damage. It is the difference between recorded stock on your company’s balance sheet and actual inventory.
Shrinkage costs businesses nearly $100 billion annually and is a part of every company’s reality. Regardless, you can minimize it by monitoring shrinkage percentage and addressing problems proactively.
A shrinkage report compares what you have in the warehouse to what you have captured on the balance sheet and presents the results as a trend over a specific period. That way, you can know whether your measures are working and zero in on exceptionally high-impact issues.
Creating inventory reports with Britecheck
The first step toward creating an inventory report is to outline what you intend to get from it. Clear key performance indicators (KPIs) will keep your reporting focused and actionable.
Once your direction is clear, it is time to gather the tools you use to manage inventory. Although many small businesses use Excel spreadsheets and manual methods for reporting, an inventory management app like Britecheck can make your work much easier, more accurate, and valuable.
Britecheck provides two of the most crucial reports in stock-keeping: stock balances for a particular date, and stock balances for a range of dates. You can generate both reports in the “Reports” section of the app. Once you execute a report, you can either view it on the Britecheck dashboard or download it in PDF.
Below is a step-by-step guide for generating these reports
Stock Balances for the Date
The Britecheck Stock Balances for the Date report gives you a list of all the items in stock and where they are located, along with the quantity, price, and value.
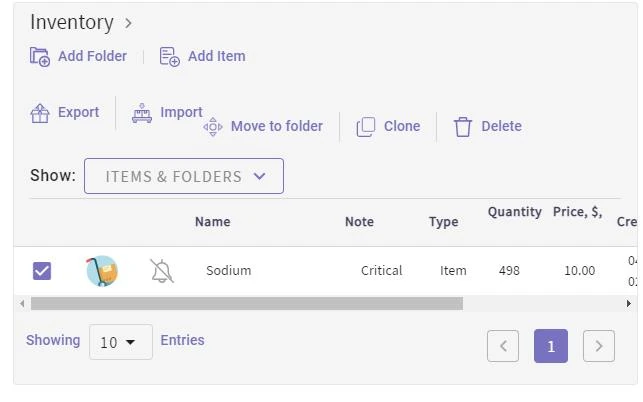
If you are new to Britecheck, you must input your product details into the app before you can generate any report. The Inventory section allows you to add items to your Britecheck database either one-by-one with the “Add Item” button, or in bulk by importing a CSV list. Alternatively, you can use the Britecheck mobile app to scan item barcodes and populate all the details automatically.
A newly added item will appear in the inventory list, and you can select it to move it to a different location (folder). You can also use the “Add Folder” button to create a new location for your items.
Once all your items are in the database, go to the Reports section and click on Stock Balances for the Date.
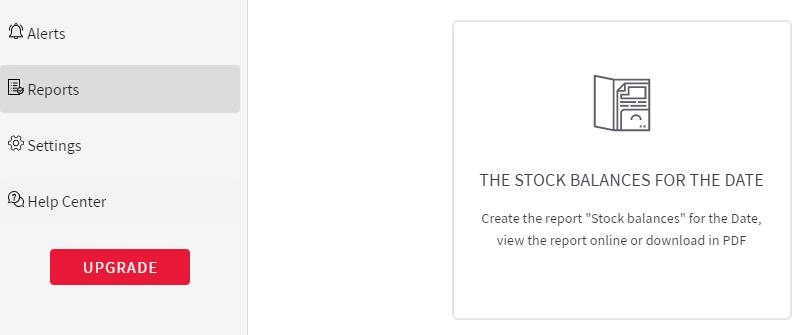
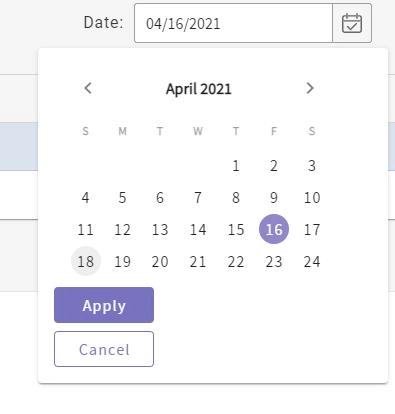
Choose the date for which you want to view the stock balances and click Apply. The Stock Balances report will be generated.
Britecheck enables you to filter your items based on locations, and sort the list by Item, Quantity, Price, or Value.
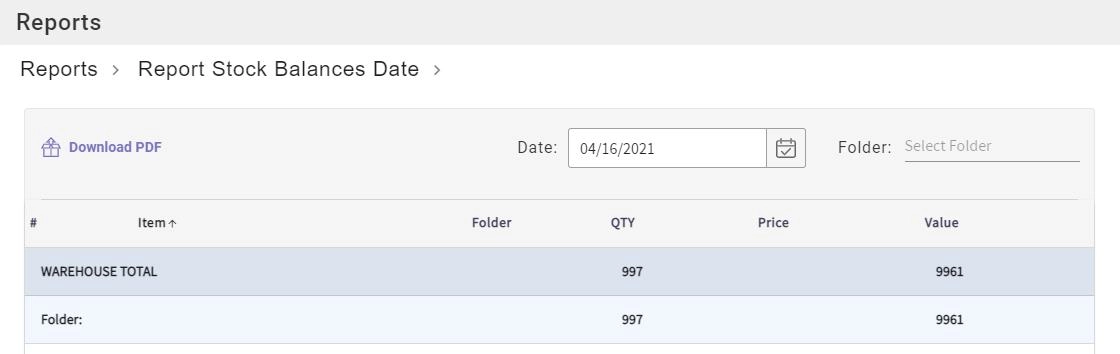
If you wish to download an offline copy, click Download PDF at the top of the page and save the report on your computer.
Stock Balances for the Range
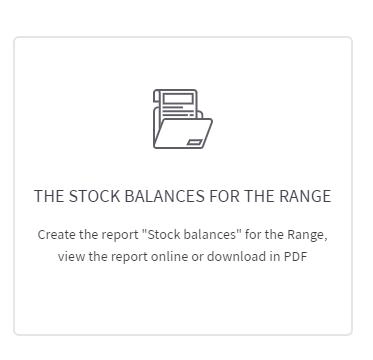
The Britecheck Stock Balance for the Range report gives the stocks at the beginning and the end of a specified period. It also tells you the quantities that have gone in and out of your store during the period.
To generate a ranged stock balances report with Britecheck, go to the Reports section and click the Stock Balances for the Range button.
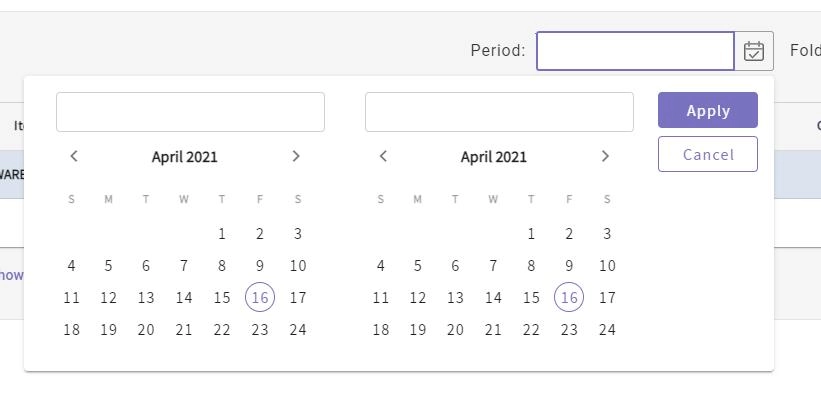
Specify the period for which you want to view the opening balances, stock movements, and closing balances and click Apply.
As with the Stock Balances for the Date report, you can filter the results by folder and sort them by Item or the quantities in each column.
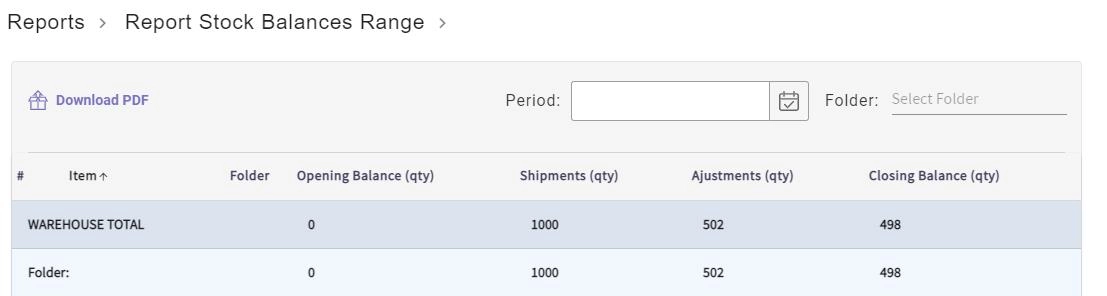
Once you are done filtering and sorting, click the Download PDF button to export the report to your computer.
Make Inventory Reporting Easy With An Inventory App
Creating, retrieving, and understanding key inventory reports are essential for tracking stock and establishing accurate level counts. Every report is a window into what is happening in your business.
Thanks to inventory apps like Britecheck, stock reports are as easy to access as ever. With an app providing accurate and real-time data, you can generate reports within seconds and gain the insights you need to leap-frog the competition.